Fvasee Integrated Data Visualization Displays for Smart City Management
Data Visualization Displays for Smart City Operations
Transforming complex urban data into actionable insights through large-scale visualization displays
Introduction
Smart city operations generate vast amounts of data from transportation systems, utilities, public safety platforms, environmental sensors, and administrative services. Without effective visualization, this data remains fragmented and difficult to interpret.
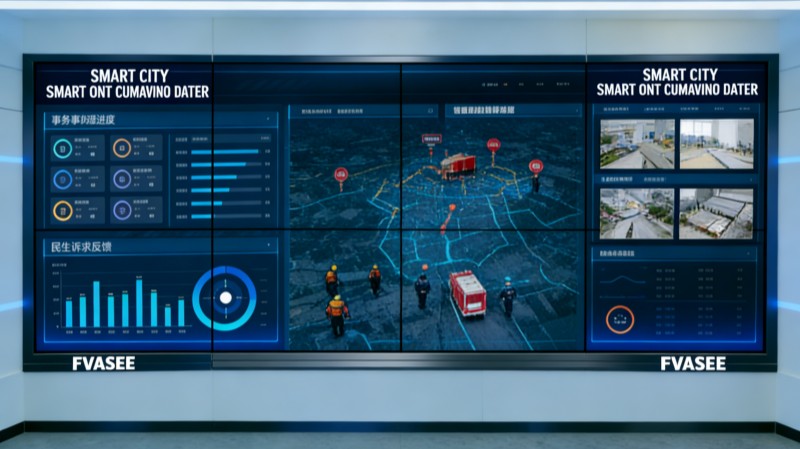
Data visualization displays for smart city operations provide a centralized platform that transforms complex, multi-source data into clear, actionable visual insights. By presenting real-time dashboards, analytics, and geographic data on large-format displays, city operators and decision-makers can better understand urban conditions and make informed decisions.
FVASEE data visualization display solutions support smart city operations with high-performance visualization, scalable deployment, and professional reliability.
Why Data Visualization Is Critical for Smart City Operations
Making Complex Data Understandable
Smart cities rely on diverse data sources, including IoT sensors, management platforms, and AI analytics. Visualization displays convert raw data into charts, maps, and dashboards that are easier to interpret and compare.
Large-format displays allow operators to view relationships between datasets, identify trends, and detect anomalies that may not be visible on smaller screens.
Supporting Real-Time Operational Decisions
Operational teams need up-to-date information to respond quickly to changing urban conditions. Visualization displays present real-time data streams, enabling faster assessment and more confident decision-making.
From monitoring energy usage to tracking public service performance, real-time visualization improves responsiveness and efficiency.
Enabling Cross-Department Collaboration
Smart city operations often involve multiple departments working together. Centralized visualization displays ensure all stakeholders share the same data context, reducing misunderstandings and improving coordination.
Key Features of Data Visualization Displays
High Resolution and Visual Accuracy
Accurate data interpretation depends on clear visuals. Professional display panels deliver sharp text, precise graphics, and consistent color performance — essential for data dashboards and analytics.
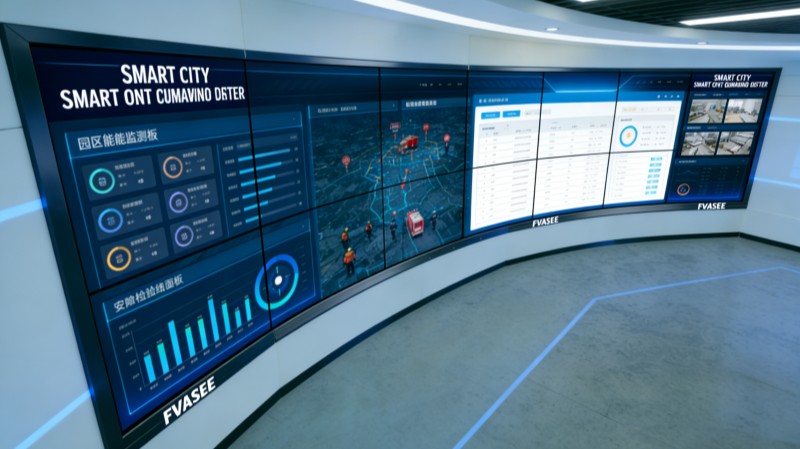
Large-Scale, Multi-View Layouts
Data visualization often requires displaying multiple dashboards simultaneously. Large-format displays support multi-window layouts, allowing operators to compare metrics across departments or time periods.
Scalable and Flexible Configurations
As smart city platforms evolve, data visualization needs grow. Display systems support modular expansion and flexible layouts, adapting to new data sources and operational requirements.
Integration with Analytics and City Platforms
Data visualization displays integrate with smart city management platforms, GIS systems, and analytics software, ensuring synchronized, real-time updates across all visual content.
FVASEE display solutions are designed to integrate seamlessly with enterprise and municipal data ecosystems.
Applications Across Smart City Operations
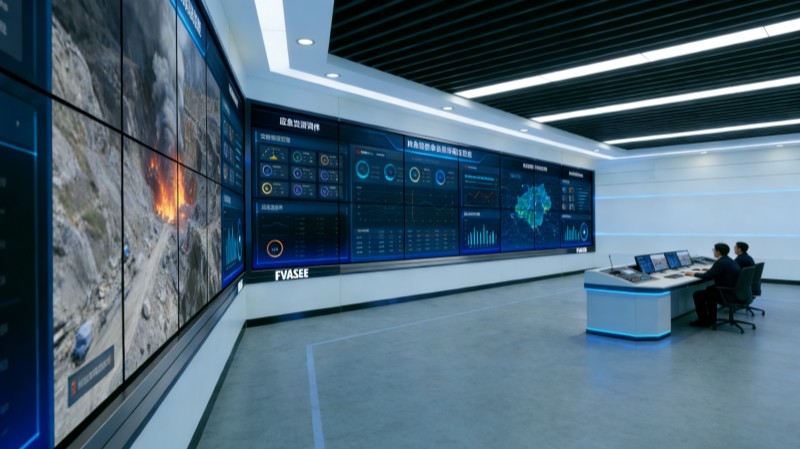
City Operations Centers
Visualization displays provide leadership teams with a holistic view of city performance, supporting strategic planning and daily operations.
Utility and Energy Monitoring Centers
Large displays help teams monitor energy consumption, water usage, and system health in real time, enabling proactive management.
Environmental Monitoring Facilities
Visualization dashboards display air quality, weather data, and environmental trends, supporting sustainability initiatives and regulatory compliance.
Enhancing Data-Driven Urban Governance
By making complex data accessible and understandable, visualization displays support a shift toward data-driven governance. City leaders can evaluate performance, anticipate challenges, and allocate resources more effectively.
FVASEE data visualization display solutions help cities build modern operations environments where insights drive action.
Conclusion
Data visualization displays are a cornerstone of smart city operations. They enable real-time insight, cross-department collaboration, and informed decision-making across complex urban systems.
With scalable architecture, clear visual performance, and reliable integration, FVASEE data visualization display solutions empower cities to turn data into meaningful operational intelligence.